This week in Intro2GIS I used ArcMap 10.2 to create three
maps while also learning about the importance of cartography. We can do more
than just make maps with ArcMap but maps happen to be one of the most useful
ways to share the data that the software helps us sort through.

 The first map I created shows the states of Mexico color-coded by their population size. In creating this map I learned about clipping shapefiles to create smaller datasets. This was a very useful tool because it made editing the symbology much easier to do. I also played around with different color combinations and label sizes to make a map that is easy to read. Some of the tools we learned about for the second map would have been useful for this first one.
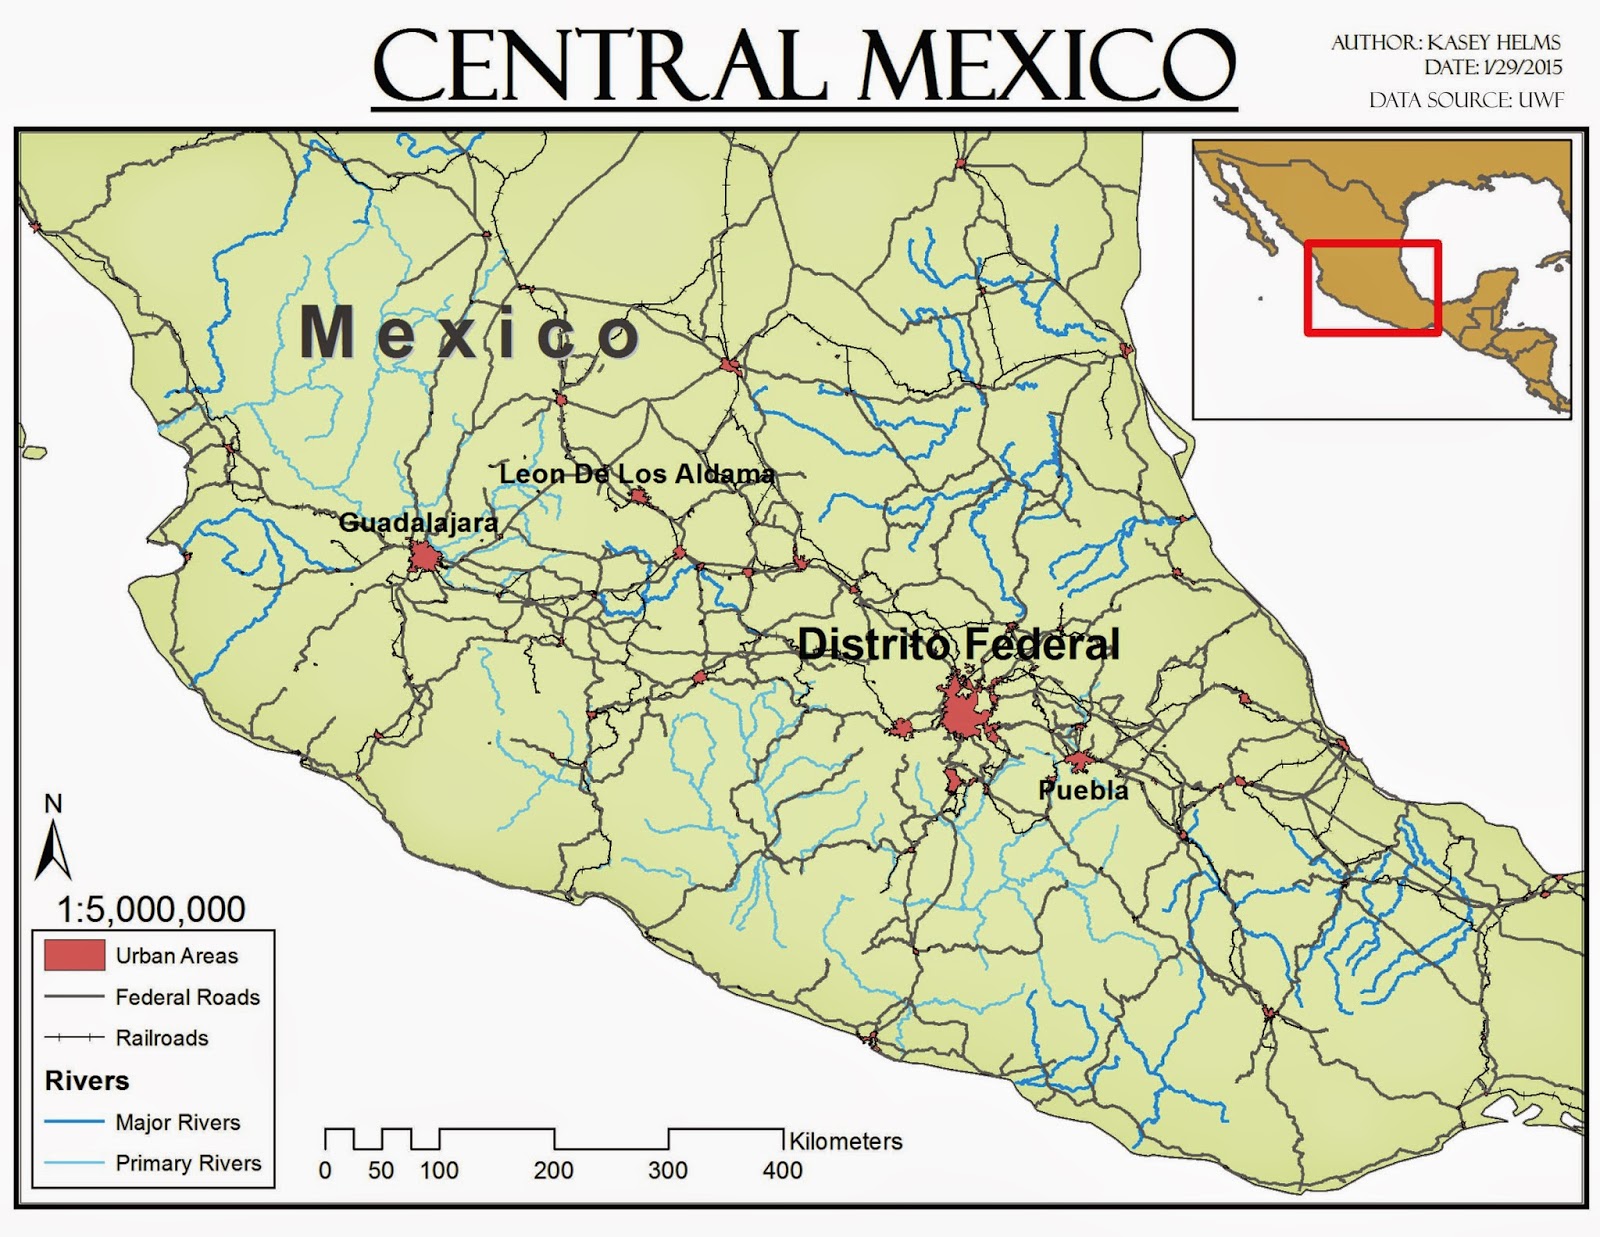
The second map shows large urban areas, rivers, railroads, and major roads in Central Mexico. I used the clipping tool again for this map and modified the symbology so the colors were more in line with cartographic guidelines. The most useful skill I learned while making this map was how to change the labels created from shapefiles into map annotation. This allowed me to move labels and edit them individually in order to make the graphic a little clearer. I also added an inset map for reference because the graphic does not show the whole country of Mexico.

No comments:
Post a Comment